Posts

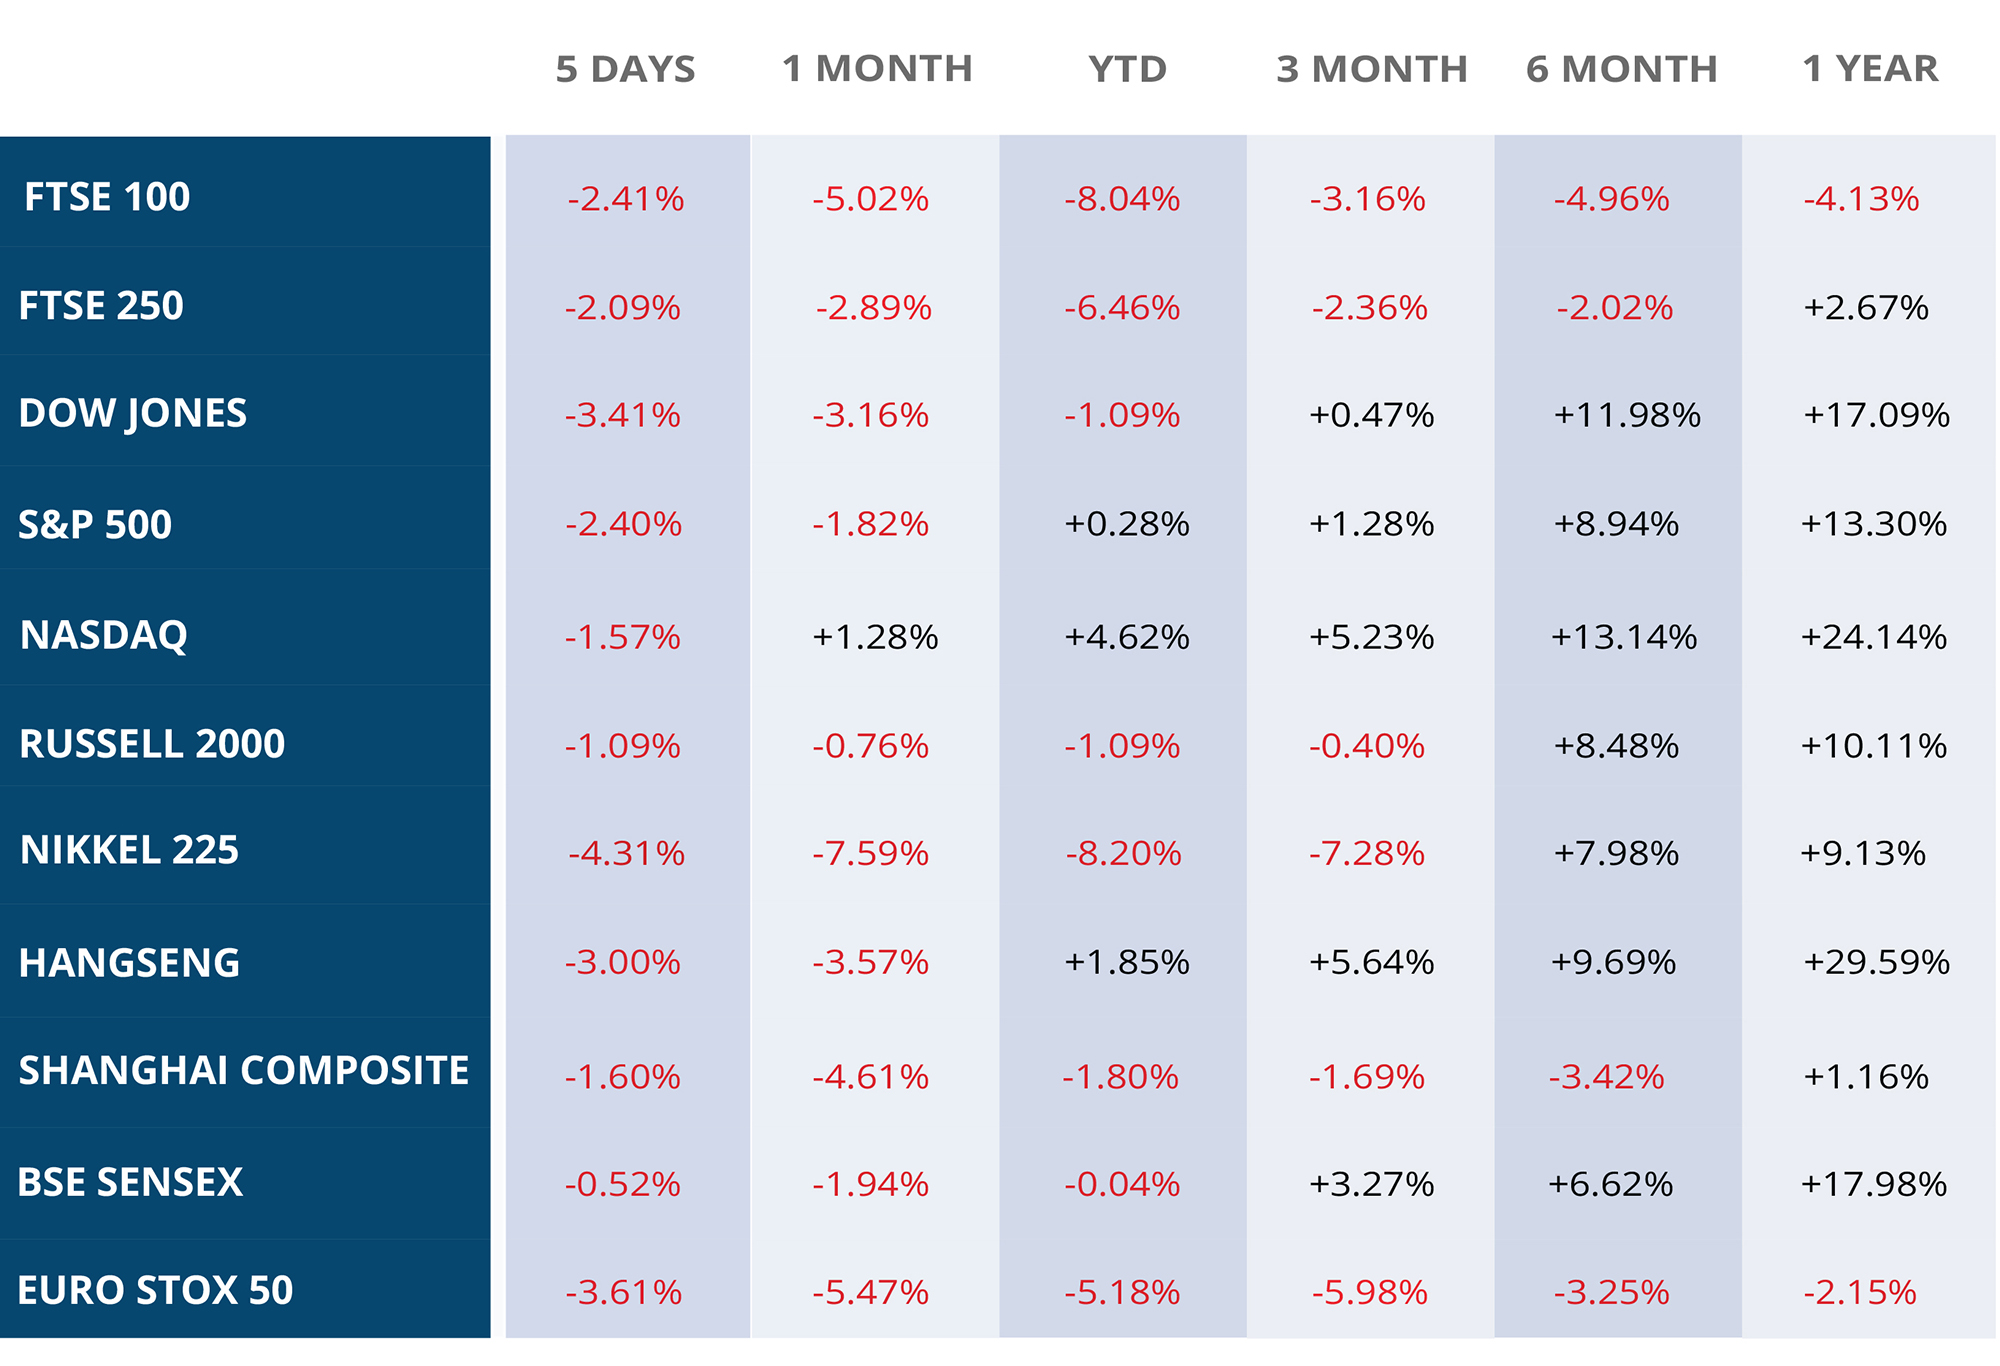
Following on from us covering the difference between Saving vs Investing and with so much reported on the recent market movements, it would be important to highlight why and what the impact is of investing at the right time. Also what the true effect is of continuing to use purchasing power over time to ultimately add value to your portfolio.

While much information circulates in our community regarding the impetus to buy good value stock, equity or units in funds, there is one classical item which could use attention with respect to the value of buying during corrective periods. That item is the power of Dollar Cost Averaging over time.

When you create and review a set of dollar cost averaging numbers, it becomes apparent that during these periods of severe price decline or correction, accompanied mental exhaustion, great wealth is made.

Illustrated below are two hypothetical price performance periods using gold as an example:


dollar cost averaging


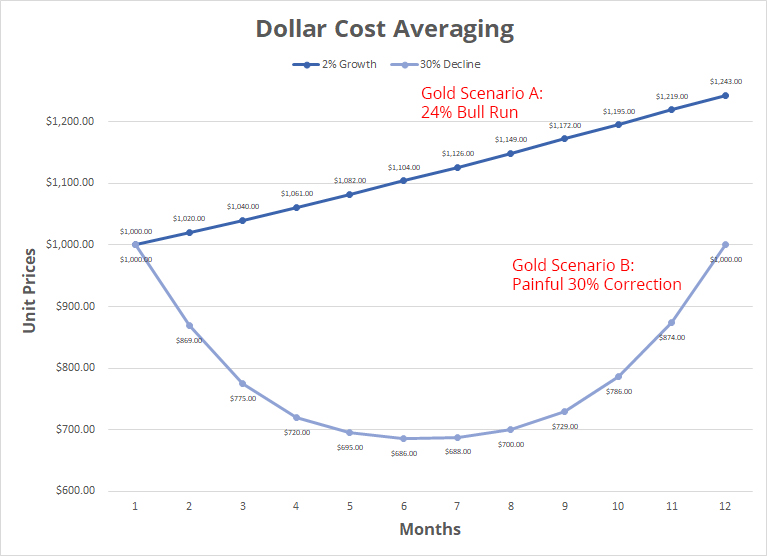
Gold Scenario A: depicts a 12-month period of increasing gold prices compounded at a 2% rate, producing a total of a 24% “bull run”. Gold Scenario B: depicts an extremely painful 30%+ correction and subsequent recovery to starting-point levels over a 12-month period.

At first glance, you might assume an investor gained 24% under Scenario A and nothing under Scenario B except for potential losses and grey hair. A closer look at a set of dollar cost averaging data however, tells a wildly different story.

Let’s assume an investor has the courage to create and execute a $1,000 a month investment program towards buying units. In applying that program to the two scenarios laid out above, a fascinating result begins to emerge:


dollar cost averaging


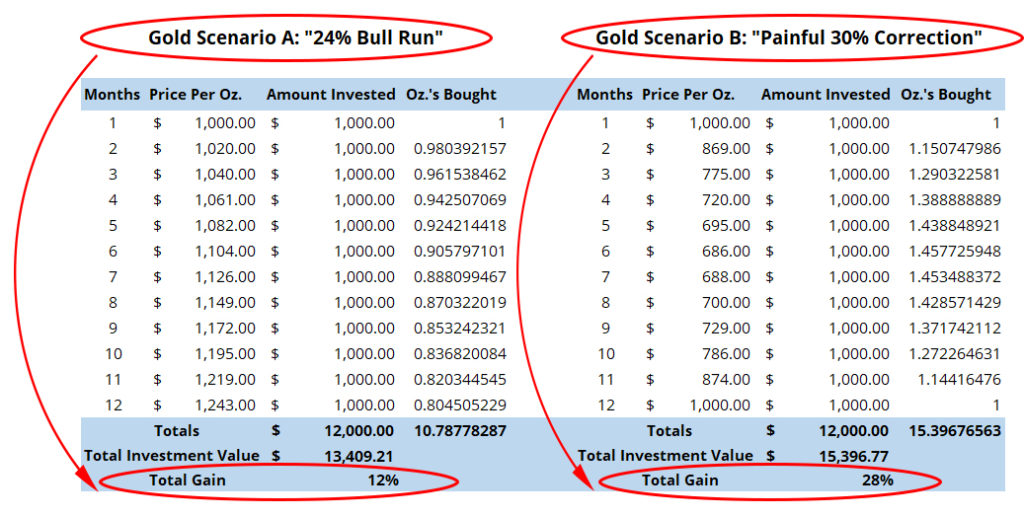
As the numbers demonstrate, Scenario A’s 24% “bull run” produced a pitiful return on capital, and as a headline figure was very misleading. A disciplined investor allocating $1,000 a month under this scenario, saw a total real gain of only 12% at the end of the twelve month period.

Under Scenario B however, our disciplined investor’s $1,000 a month investment program produced a total real gain of 28% on his or her capital, in what could be described as a “sideways” (or unprofitable) unit price environment.

What’s also interesting to note, is that not only did Scenario B produce a far greater gain, but it does so at a (counter-intuitively) much lower risk.

To illustrate, let’s assume that at the end of the 12-month period Scenario A suffers a “minor dip” in price, returning to its initial starting level at $1,000 per unit. Let’s also assume Scenario B jumps by 24%, effectively switching places price-wise with Scenario A. Here is a chart of that price swap:


dollar cost averaging


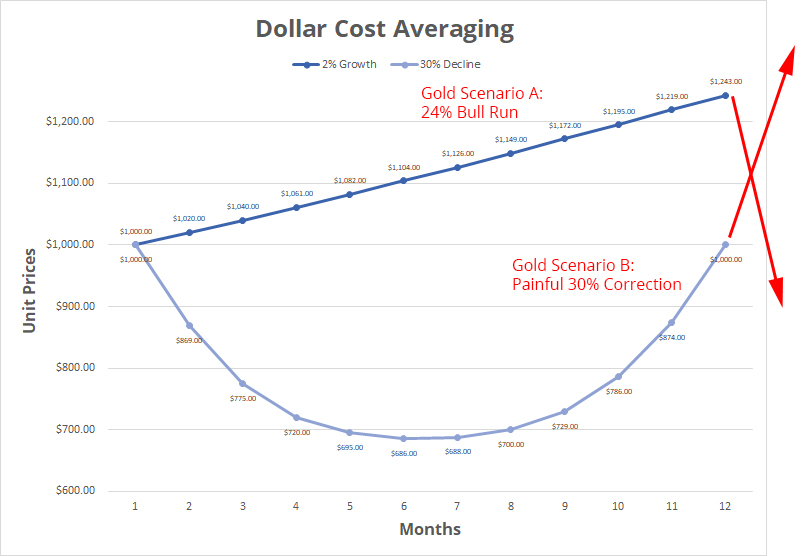
As mentioned, while this price swap appears to be just a “minor dip and corresponding jump”, as the numbers will indicate, the risk of financial loss in Scenario A becomes staggering, while the upside gains under Scenario B become equally explosive:


dollar cost averaging


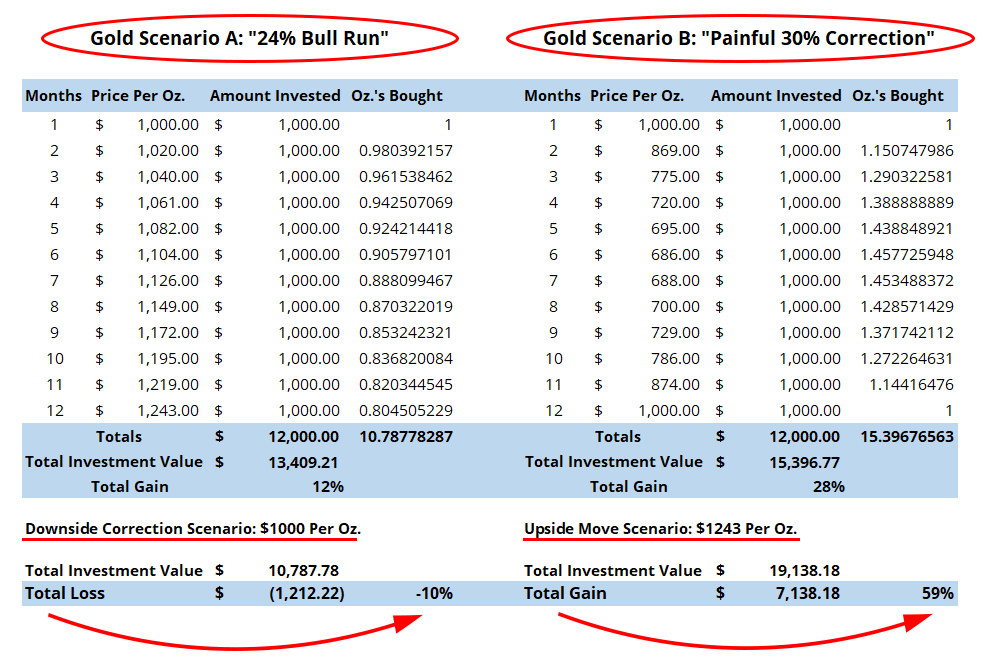
As demonstrated, a correction to starting point in Scenario A produces a real total loss of 10%. A price swap in Scenario B on the other hand (i.e. a move from $1,000 per unit to $1,243 per unit), produces a 59% total gain. Therefore, the disciplined investor who continued to allocate $1,000 a month in the face of a frightening 30% collapse, was rewarded tremendously.

The moral of the story here is to continue to add fresh capital to your investments during declines. And it doesn’t have to be in just one Fund you can utilise those Funds surrounding Commodities, Healthcare, Technology or Shares of Companies.

Additionally, when struggling through the corrective depths of any asset’s “Scenario B”, it’s important to ensure that whatever you’re accumulating has real (and strengthening) fundamental value. Therefore, the longer the corrective period persists the greater will be your ultimate upside in the subsequent recovery. In other words, with strengthening fundamentals time is labouring for you rather than against you.

Bottom Line: The discipline of incremental investment over time may position one for explosive upside gains and reduced downside risk. Ensure that whatever is being accumulated however, is fairly priced, and of increasing fundamental value.

savings vs investing

One of the reasons many people decide to live and work in the UAE is the zero per cent income tax. If that’s your case, the incentive might be an excellent opportunity for you to save more money. After all, you don’t have to pay out a large chunk of your salary each month in income tax.

Being able to save more money is great, because you want to ensure that money is there when you need it, not just for now but later in life. Whether it is for a comfortable retirement, your children’s education or a large asset purchase, you want to have money available.

Although this may be true, using a local or international bank to build up cash deposits won’t help your savings. The reason for this is simple. There is often zero or very little growth to this cash resulting in erosion due to real-time inflation. At the end of the day, your money is losing purchasing power while sitting in a bank savings account. Another key point to consider is the nature of a savings account. The money is always readily available to you. So you might end up using this cash to buy that extra pair of shoes, a night out or any other unnecessary purchase.

There’s a Better Way to Save

An anonymous source once said, “If you never save money or invest, you will always be poor, no matter how much you earn.” That’s a fact! We all know that if you always spend everything you earn you will never have money.

As mentioned before, saving money is great. You should keep it up but in a more structured way. A way that gives you the medium to long-term growth opportunity while maintaining an element of access in times of difficulty.

Did you know that if you save your money rather than investing it, you will probably have to put away a lot more for a lot longer to achieve the same result?

Let’s take a look at the case study of ‘John Saver’ and ‘Daniel investor’ as an example.

John Saver vs Daniel Investor: A Case Study

Both men are the same age, working for the same company and earning the same income. They both have no debt, and very little in terms of assets. However, they are at a point where they understand the importance of putting aside money for their future. They feel that they need to save $1 million by the age of 60 to be able to retire comfortably.

John Saver:                                                                                                     

  • Age: 40
  • Annual Salary: $100,000 USD ($8,333 pm)
  • Current Savings: $100,000 USD
  • Savings Goal by 60 (Retirement): $1,000,000
  • Required Monthly Contribution: $3,750

John is already 50% through his working life but has only managed to save one tenth of the amount he needs to retire. To get to the desired $1 million, he needs to put away $3,750 per month into his bank account for 20 years.

The problem is that John has always been a bit of a spender. It might be very ambitious and quite challenging to change that suddenly and put away almost 50% of his salary towards savings.

As a result, John often fails to either set aside the total amount or dips into his savings as unexpected costs arise.

Daniel Investor:

  • Age :40
  • Annual Salary : $100,000 USD ($8,333 pm)
  • Current Investment: $100,000 USD
  • Investment Goal by 60 (Retirement): $1,000,000
  • Required Monthly Contribution: $2,000

Daniel is also in a similar position. He is already 50% through his working life and has only managed to save one tenth of the amount he needs to retire. However, Daniel decided to set up a savings account aimed at investing regularly. To achieve his retirement goal of $1 million, he will have to contribute $2,000 per month.

This money is directly debited from his account the day after his salary is deposited as a disciplined action. Therefore, he doesn’t even have a chance to notice the money gone.

Daniel’s funds are then actively invested and managed. They are now benefiting from the wonderful wonders of compounding interest. This means he is taking full advantage of accumulating interest on top of accumulated interest for all the years he is investing.

Let’s put compounding interest into perspective. Daniel’s initial deposit of $2,000 will be worth $5,300 at the end of the 20-year term! At the same token, his first year’s contribution of $24,000 will be worth $63,700 by the end of the term*.

As a result, Daniel can continue leading the life he enjoys. He can keep the small luxuries and current lifestyle, knowing he is well on the way to achieve his retirement goals.

In fact with the additional spending money that he is left with every year, Daniel is planning on taking a three week holiday travelling around Europe later this year and will be on track with putting a down payment on an investment property this time next year.

If Daniel decided to contribute the same amount to his investment plan as his friend John, he would have a whopping additional $787,000 in his pension pot by the time he was ready to retire.

So ask yourself… Do you want to work smarter, or harder? Are you John or Daniel?

* This projection is based on illustration purposes. If you decide to set up any structured savings, the term should be determined by affordability and time scales in the UAE. A short-term plan may suit you better.

Reduce your portfolio risk

You no doubt have heard about the benefits of diversification, It’s not just “all talk”. Your portfolio must have some degree of diversification. After all, you don’t want to “put all your eggs in one basket”.

Investing all your money in one or a limited number of assets increases the risk of your portfolio. If something goes wrong with one of these assets, this could impact all your money. Rather than having all your eggs in one basket, you take some and put them in different baskets (asset classes). That’s diversification.

What is Diversification?

Diversification is the attempt to reduce exposure to risk by spreading your investment across carefully selected asset classes and geographical regions. You can achieve diversification by allocating, for instance, a certain percentage of your investment to fixed income, equities, real estate, alternative investments, in different sectors, industries or countries.

Although diversification is no guarantee against loss, it’s a prudent strategy you can adopt towards your long-term financial goals.

Why Diversification Work?

Many studies demonstrate the effectiveness of diversification. To put it simply, when you spread your investment across low correlation assets, you reduce the exposure to volatility. The reason for this is that different asset classes and geographical regions don’t move up and down simultaneously or at the same rate. So, if you mix things up in your portfolio, you’re less likely to experience major drops. Remember that some sectors might be thriving while others are going through tough times.

How to Diversify Your Portfolio?

Personal finance courses teach this concept widely in contrast to individual stocks investing. They consider single stock investing similar to casino gambling. In fact, many investors never even invest in individual stocks. Instead, they prefer mutual funds and exchange-traded funds (ETFs). These funds bundle hundreds of stock from various companies and sell them as a singular unit.

You can diversify your portfolio by selecting mutual funds and ETFs from different sectors that follow different trends. Some might follow the ups and downs of the broader market while others remain relatively flat. Other funds might move inversely to the broader market, experiencing ups when most sectors are down and vice versa. So no matter how the market is behaving, a portion of your portfolio is likely to do well. At the same time, this strategy protects against the full exposure of a correction.

Generally speaking, a well-balanced portfolio diversifies away the maximum amount of market risk. Owning additional asset classes takes away the potential of big gainers significantly impacting your bottom line. This is the case with large mutual funds investing in hundreds of stocks, in theory, putting your eggs in hundreds of different baskets.

Monthly Market Summary

August 2018

US

The strong earnings report and better than expected economic data prevailed over the trade war hysteria in the markets. A year on year increase of 6.6% in retail sales, a strengthening labour market with 213,000 new non-farm jobs created. Also, a stable Purchasing Managers Index (PMI), indicated rising consumer sentiment and business confidence in the US economy. The GDP rose by 4.1% in the second quarter, with inflation sitting at 2.9% which was above the Fed’s target and in the process making a case for rate hikes. The second quarter earning figures came out very strong with a majority of the companies beating estimates. Over the month the S&P gained 111.34 points (+4.12%), the Dow was up by +5.19% (1253.66 points), and the benchmark US Small Cap Index Russell 2000 was up by 29.07 points, a gain of 1.77%.

UK

BREXIT uncertainty remains the core concern of the UK markets. However,  investors are hopeful that by the end of the year things will be much clearer about the type of BREXIT the UK is likely to have. The recent data suggested that the UK economy is going through a temporary slowdown.  Nevertheless,  the manufacturing and service sectors remain positive with a strong labour market and an unemployment rate below 4.2%. Sterling fell against the USD, aiding the FTSE 100 to end the month up 1.46% (111.83 points), the FTSE 250 gained 46.9 points (+ 0.23%).

Europe

The Eurozone composite PMI dropped marginally to 54.3 from 54.9 in June. German manufacturing PMI showed increased activity despite the risk of increased tariffs on automobiles. The ECB kept the rates unchanged and signalled to maintain them until the first half of 2019 at least. Trade tensions weakened in the latter part of the month after the EU President visited Washington and held talks with the US Trade representatives. Euro Stoxx 50 over the month gained 4.4% (149.93 points), and EURO ended the month at 1.17 (+0.2%) against USD.

Emerging Markets

The Chinese markets were the most affected as both US and China intensified their trade dispute, with new tariffs imposed and threats to add further tariffs. Signs are building that the economic expansion is losing steam—from weakening investment in factories to anaemic household consumption and rising corporate defaults. China’s central bank has been pumping funds into the country’s financial system. The Yuan fell -2.9% against USD over the course of the month.

India remained the second-best performer for the month of July 2018, with a return of 6%. Brazil was the best performer with returns of 9%.

Source: JP Morgan Asset Management, Wall Street Journal and CNBC News

WEEKLY EQUITY MARKET UPDATE – 05/08/2018

history of volatility

During the first half of the year, we have seen varied levels of volatility around the world. This was triggered by several events such as political decisions (mainly in the US), fluctuating oil production, trade dispute, conflicts, uncertainty and the end of Quantative Easing.

As an investor, you should know that investing is a marathon, not a sprint. Investing with a long-term outlook and long-term goals is the best way you can reduce the impact of stock market fluctuations. However, you no doubt may ponder over the risks and rewards of investing. Ponder over how to manage your portfolio to minimise the effects of adverse markets movements.

The first thing to understand is that risk is a necessary and constant feature of investing. Stocks fall, economic conditions fluctuate and companies can go bankrupt. In fact, the very returns that assets generate may reward you for the risk you take.

Secondly, there are many different asset classes available you can invest in, each possessing different risk traits.

With that in mind, one of the best ways to weather volatility is making sure to diversify your portfolio. Diversification may help to boost returns over the long-term and provide some protection against losses, giving you greater peace of mind in periods of market turbulence.

The ten-year chart below illustrates the extent to which different asset classes tend to perform well at different times.  Let’s take a look at the government bonds for instance. They underperformed when equity markets were rising but did better in periods of crisis. The chart demonstrates that past performances cannot be used as a guide to future returns.


Asset Class Returns

Asset-Class-Returns-1H-2018


A well-diversified portfolio spread across a range of assets, markets and geographical regions, has the potential to provide you with lower volatility.  It helps you to avoid overexposing your portfolio as a whole to undue risk.

Monthly Market Summary

July 2018

The Trade war between the US and China intensified in June with President Trump announcing the updated list of Chinese goods worth $ 50 billion, that will be subjected to a 25 per cent tariff with effect from July 6. The Chinese side reacted by issuing a revised list of US goods worth $ 50 billion that will have a tariff imposed. The list targeted agriculture products particularly from places that supported President Trump during the US presidential primary elections. President Trump responded to this by threatening to impose additional 10% tariffs for another $ 200 billion worth of Chinese imports.

Equity funds suffered one of their largest weekly outflows during the last week of June, with $29.7 billion pulled out of risky assets over concerns of rising US protectionism and its likely effect on the global economy.

US equity funds lost $24.2 billion as per the EPFR data, outflows from emerging market (EM) equity and debt funds also increased as investors exited EM assets, citing the currency risks from a strengthening US dollar. Around $18 billion worth of funds exited EM equity and debt funds in June following an $8 billion outflow in May.

Around $ 3.9 billion was pulled out of European equity, and a net inflow of $ 2.6 billion was reported into Japanese Equity funds.

Among equity sectors, Technology has been the most resilient to trade worries, although threats to curb Chinese investment in US tech firms hit their stock value. Tech continued to draw the strongest inflows with $0.8 billion and was on a year-to-date total of $19 billion inflows while $9 billion has left all other sector funds.

In fixed income, investment-grade bond funds saw strong inflows of $2.9 billion as investors fled to safety, while high-yield bond funds saw outflows for an eighth consecutive week, with $2 billion removed.

The UK employment figures came out positive, as the latest figures signalled falling unemployment with falling wage growth. The Bank of England postponed its rate hikes and decided to leave the interest rate levels unchanged. The FTSE 100 index lost 41 points over the month and ended at 7636.93. The weakness in sterling against the dollar helped FTSE produce local currency gains as the foreign currency revenues were repatriated.

The concerns of an exit of Italy from Eurozone eased after the new government showed signs of stability. The most important development in Eurozone was the decision of the ECB to curtail its bond-buying program after September. The Euro Stoxx 50 ended the month at 3395.6, down 25 points (0.74%) over the month.

The Chinese markets over the month were troubled by the trade war concerns with the Shanghai Composite and the Hang Seng Index ending the month at 2847.42 (-7.69%) and 28955.1 (-5.22%) respectively. The Indian market remained under pressure from rising oil prices and the resulting fall in rupee against the USD, over the month the BSE Sensex ended at 35423.5, up 0.14% from last month.

Source: www.moneycontrol.com / JP Morgan Asset Management

WEEKLY EQUITY MARKET UPDATE – 08/07/2018

Monthly Market Summary

June 2018

The month of May started with a positive for the US and global markets as President Trump delayed the controversial trade tariffs for 30-days, giving EU and other allies time to negotiate a trade deal with the US. A high-level delegation was also sent to China for trade talks easing the concerns of a trade war.  However, over the month, the markets witnessed intermittent bouts of corrections as the concerns over US-China trade war remained one of the important driving forces for Wall Street. The Asian Pacific remained susceptible to the trade concerns with the China-related stocks being the most affected. Another major source of volatility for Asian Pacific Equity was the geopolitical uncertainty arising from the cancellation of the planned North Korean Talks in Singapore.

Meanwhile, the US Inflation hit the Feds 2% target, the rise in prices was attributed to the economic expansion. The Fed signalled on growing confidence in inflation leading to the strong possibility of rate hikes in June.  The threat of inflation and the possible rate hikes by the Fed prompted selling in the fixed income market keeping the yields near the highs of 3%, the fed however held the interest rates steady. The US announced USD 1 billion increase per month in its short-term borrowings, the increase in the long-term borrowing was limited to USD 1 billion per quarter leading to a narrowing differential between the 2-year and 10-year bond yields, a signal of yield curve flattening. The yield differential further narrowed by the end of the month as market speculations rose over trade war and monetary policy outlook intensified.

The FTSE 100 was propelled by the rising oil prices to its three-month high in the second week of May with British Petroleum and Royal Dutch Shell accounting for about half of the month’s gain.

The political risk emanating from Italy continued to roil the European markets over the month, with an estimated outflow of USD 4.5 bn from the Western European markets. However, the concerns eased by the end of the month as policymakers in Rome began talks to form a coalition government and avoid snap elections.

The Oil started the month by reaching a four year high of $ 75 a barrel, the prices were driven up by rising demand due to global economic boom and cuts in supply from Open and Russia, in addition to the geopolitical risk arising from the brewing conflict in middle east putting the Iran nuclear deal in jeopardy. However, the prices recovered in the later days of months as reports came out suggesting that the OPEC may wind down production cuts in response to the prospect of reduced supplies from Venezuela and Iran.

The UK pound after reaching the post – Brexit peak last month, took a 3.36% plunge in May, the fall was prompted by the weaker than expected manufacturing data and a weaker outlook for UK inflation. The UK inflation data in the 3rd week of May showed a fall in UK inflation to 2.4%; this was the second consecutive month of drop in inflation.

The US dollar in the early days on May saw a reversal from the weaker outlook as the fears of narrowing policy differentials between the US and Europe, and the US and Japan dissipated as the central banks of Europe and Japan softened their stance on monetary policies.

WEEKLY EQUITY MARKET UPDATE – 06/06/2018

cheese & wine

The Sun had set, the temperature dropped, and the late evening was upon us. There was excitement in the air and with a backdrop of the Dubai Marina skyline the stage was set at Emirates Golf Club, but this was for something more than just a round of Golf.

On Thursday 19th April, we held the AOP Spring Client Cheese & Wine night, courtesy of Jones the Grocer at Emirates Golf Club.

Having held the event in December 2017 we chose a new venue & partner, offering a varied experience of bites, grapes and live music to set the mood and give something back to our loyal clients.

With an unlimited cheese board consisting of Manchego, Brie De Meaux, Blue De Caisses, Buche Jacquin Herbes and Keen’s Cheddar. Flavours that were soft, strong and bitey and a fine selection of Fondue with Breads, Grisini and Antipasti there was enough to satisfy even the biggest of appetites.

This was all washed down by a wine selection that didn’t disappoint with Whites giving subtle taste and zesty flavours from Chardonnay to Sauvignon and Semillon. Bold Reds from Merlot, Shiraz and Cabernet hitting the spot with big fruity undertones. Also, a Zinfandell that was like a glass full of strawberries, whatever your taste there was something for everyone.

The ambience was ever flowing with a live band giving us a twist on modern Jazz and funky covers. There were even a few movers and shakers at the dancefloor! The setting was great and the people were wonderful. A fantastic evening enjoyed by all, with a request for the next one to be sooner rather than later.

“A bottle of wine contains more philosophy than all books in the world” – Louis Pasteur

Monthly Market Summary

April 2018

The volatility in March was mostly driven by the concerns of a Trade War between the two biggest economies in the world, namely the US and China. The month started with the hawkish tweets from Donald Trump signalling possible tariffs on imports, although the rhetoric toned down with the Europe managing to get an exemption from tariffs. The markets feared that any retaliatory measure from the Chinese side will dampen the trade and the hard-won growth momentum in the economy. The threat of the trade war became real when the Trump administration announced the tariffs on steel imports from China.

The market sentiment was further dampened by Fed’s interest rate hike, which was the first of its four-planned rate hikes this year and the sixth since it began raising interest rates in December 2015. The Technology sector took a major dip due to the risk of increased regulations after Facebook was found to have been involved in a user-data controversy linked to Donald Trump’s presidential campaign in 2016.

Summing it all up, markets in the month of March followed the high volatility trend it inherited from February 2018, depicting the phenomenon of “Volatility Clustering” which essentially means a period of high volatility is followed by another period of high volatility till a reversal or an inflection point is reached.

The major US markets ended the month in red with the Dow Jones Industrial Average losing 3.68 per cent, while the Standard & Poor’s 500 Index sliding 2.74 per cent and the NASDAQ Composite falling 2.90.

In addition to the global trade concerns, the BREXIT woes continue to haunt the UK markets. The FTSE 100 & FTSE 250 ended the month in negative 2.42% and negative 1.15% respectively.

Despite stronger earnings data in Europe, the markets succumbed to the pressure of increased tariffs and the resulting trade war. The STOXX 50 lost nearly 2% over the month.

The Nikkei 225 lost 2.04% this month, the Japanese bourse came under pressure from a stronger yen and global trade fears. It is also a major concern among investors that Japan can be the next target of US trade tariffs. The major emerging markets moved in concert with the developed markets, with the HangSeng losing 1.26%, the Shanghai Composite down by 2.05% and BSE Sensex fell by 3.43% in March.

Despite the increase in rates by the Fed, the Treasury yields fell in March due to the revised labour report, weaker than expected inflation data and the increased buying activity in the bond markets prompted by the volatility in equity markets as the investors looked for safer assets in the market. The 10-yr Treasury Yield ended the month at 2.741%, down 0.131 percentage points.

WEEKLY EQUITY MARKET UPDATE – 01/04/2018

Monthly Market Summary

March 2018

Fears of Trade War drive stocks down as the key US share indexes came under pressure in early hours of trading on Friday as President Trump in his tweets indicated of his plan to impose tariffs on steel and aluminium. The news pulled down the global markets amid the possibilities of retaliation from China and major economies and the consequent slowdown in global trade. The Dow finished up 0.3% as most of the losses were recovered in the later hours of trading. Regardless of the late recovery, the indexes witnessed one of the worst weeks this year. The DJIA, S&P 500 and NASDAQ posted their weekly figures of -3%, -2% and -1.1% respectively. The threat of an international trade war also sparked concerns in the fixed income markets as the companies may look to pass on the rise in cost from tariffs to the consumers. It is causing an increase in the expected inflation, leading to a rise in the yield of the 10 – year Treasury Note to 2.855% on Friday from 2.802% on Thursday. The Japanese equity was worst affected by the trade concerns as the steel industry and automakers bearing the brunt of the trade restrictions. The Nikkei ended the week at 21,181.64, a loss of 3.25 percent against the week earlier. The large-cap TOPIX Index fell 2.96 percent for the week and declined 6.01 percent YTD. The FTSE 100 index ended at 7,069.90, the lowest close since Dec. 23, 2016, according to FactSet data. No sector gained ground, and the basic materials group fell the most. For the week, the London benchmark fell 2.4%, a second straight weekly decline. The political risk in conjunction with the weaker economic prospects arising from inflation and a lack of real wage growth and the issues related to BREXIT has resulted in mounting pessimism towards UK equities. Emerging markets are likely to pay a heavy price as the proposed trade restriction will result in higher commodity prices in the international markets and the consequent fall in the local currencies. Emerging markets have witnessed an outflow of $5.8 billion of funds from non-resident investors last month, a report from the Institute of International Finance shows.
WEEKLY EQUITY MARKET UPDATE – 04/03/2018